Market research can reduce uncertainty, but it can also create false confidence. A polished report, a large survey, or a busy dashboard may still support the wrong decision when the research question, sample, method, or interpretation is flawed. The greater risk is not missing information. It is trusting evidence that does not represent the decision being made.
These errors can affect product launches, pricing, customer segmentation, market entry, advertising, service design, demand forecasting, and competitor analysis. Some become visible during data collection. Others remain hidden until customers behave very differently from the research participants.
Decision principle: Market research does not remove uncertainty. It should reveal what is known, what remains uncertain, and which assumptions could change the decision.
Why Market Research Can Produce Wrong Decisions
Research moves through several connected stages: problem definition, market boundaries, participant recruitment, data collection, analysis, interpretation, reporting, and implementation. An error near the beginning can travel through every later stage. A perfectly analysed dataset cannot repair a poorly defined target population.
Research findings also depend on context. Customer needs may vary by location, use case, income, company size, buying authority, season, distribution channel, or product maturity. A finding that is accurate for one group may be misleading when applied to the whole market.
| Research Stage | Typical Oversight | Misleading Result | Possible Decision Error |
|---|---|---|---|
| Planning | Unclear decision question | Interesting but unusable findings | Teams interpret the same report differently |
| Sampling | Wrong participants | Biased preferences or demand estimates | Product designed for an unrepresentative group |
| Measurement | Leading or hypothetical questions | Inflated interest and purchase intent | Demand is overestimated |
| Analysis | Segments combined into one average | Important differences disappear | One unsuitable offer is used for several audiences |
| Reporting | Uncertainty or limitations omitted | Findings appear more certain than they are | A large commitment is made too early |
Common Assumptions That Weaken Research
- More responses always mean better evidence. A large biased sample can be less useful than a smaller, carefully recruited sample.
- Existing customers represent the whole market. They exclude non-customers, former customers, competitor customers, and people who rejected the category.
- People can accurately predict future purchases. Stated intent often changes when price, effort, timing, and competing options become real.
- A survey is suitable for every question. Surveys measure selected answers well, but they may not reveal hidden needs or observed behaviour.
- Recent data is automatically relevant. Fresh data can still use the wrong definitions, audience, location, or collection method.
- Numbers are objective by themselves. Metric selection, exclusions, weighting, chart scales, and segment definitions all involve judgement.
Market Research Mistakes That Distort Decisions
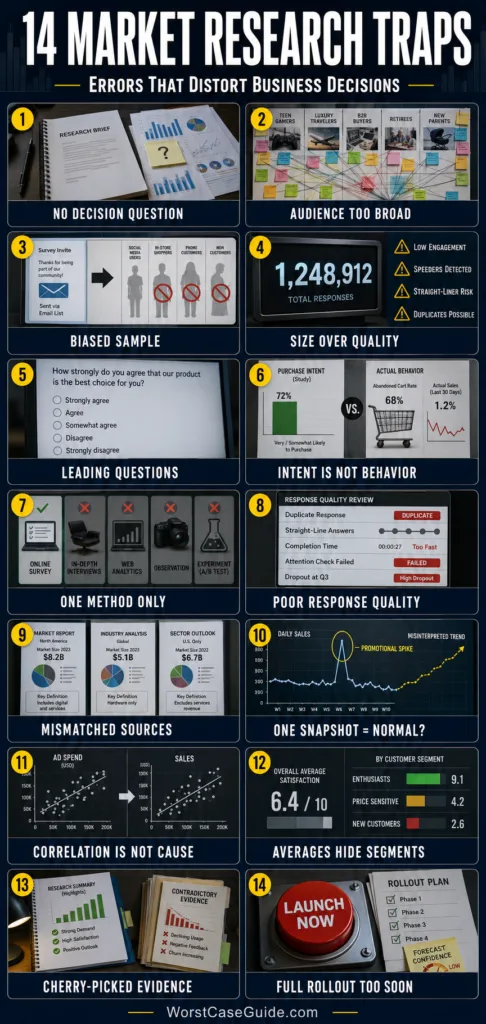
Mistake 1: Starting Without a Defined Decision Question
Why It Happens
A team may begin with a broad request such as “understand the customer” or “study the market.” The research objective sounds reasonable, yet it does not identify which decision will follow, what options are being compared, or what evidence would change the current plan.
Early Warning Signs
- The questionnaire contains many “nice to know” questions.
- Stakeholders give different answers when asked how findings will be used.
- No decision threshold, success measure, or deadline has been recorded.
- The research brief lists topics rather than testable questions.
Worst-Case Outcome
The project produces attractive charts but no shared interpretation. Different teams select the findings that support their preferred plans, and the original decision remains unresolved after time and budget have already been spent.
A Safer Approach
A useful brief can connect each research question to a decision: What will be chosen, what evidence is needed, and what result would change the choice? Exploratory interviews may suit an unclear problem, while a survey or experiment may suit a defined hypothesis.
Mistake 2: Defining the Market or Audience Too Broadly
Why It Happens
Broad labels such as “small businesses,” “parents,” or “online shoppers” are easy to use but hide major differences. The buyer, user, approver, budget holder, and product beneficiary may also be different people.
Market-size estimates can create another problem. Total addressable market, serviceable available market, and realistically obtainable market answer different questions. Treating them as interchangeable can inflate the opportunity.
Early Warning Signs
- Audience definitions depend mostly on age, gender, or company size.
- No distinction exists between users, purchasers, influencers, and approvers.
- People with very different needs are placed in one segment.
- Market-size figures include customers the business cannot currently reach or serve.
Worst-Case Outcome
A product may be built for a broad audience that does not share one problem, one buying process, or one willingness to pay. Positioning becomes vague, acquisition costs rise, and the apparent market opportunity fails to convert into demand.
A Safer Approach
Audience boundaries can reflect need, behaviour, context, purchasing role, eligibility, access, and use case. In B2B research, industry, company size, authority, buying stage, and technical environment may matter. In consumer research, the occasion and problem being solved may explain more than demographics alone.
Mistake 3: Recruiting a Convenient but Unrepresentative Sample
Why It Happens
Existing customers, social media followers, employees, newsletter subscribers, and personal contacts are easy to reach. They are also more familiar with the organisation than many prospective customers. This creates coverage bias when part of the target population has little or no chance of being included.
Early Warning Signs
- Most participants come from one channel or customer list.
- People who abandoned, returned, cancelled, or chose a competitor are absent.
- Recruitment depends entirely on voluntary responses.
- The sampling frame does not match the defined population.
Worst-Case Outcome
Research may overstate satisfaction, brand awareness, product fit, or loyalty. A decision based on enthusiastic existing users can fail when introduced to colder audiences who have different objections and expectations.
A Safer Approach
Recruitment can include relevant customer states: active customers, new users, lapsed customers, lost prospects, category non-users, and competitor customers. Probability sampling is not always practical, but limitations of non-probability and convenience samples can be recorded and reflected in the claims.
Mistake 4: Treating Sample Size as the Only Measure of Quality
Why It Happens
A large response count looks reassuring. Yet size does not correct selection bias, nonresponse bias, duplicate entries, poor screening, or faulty questions. It can merely make a biased estimate look more precise.
Early Warning Signs
- The report highlights the total sample but not subgroup sizes.
- Small segments are compared as though their estimates were stable.
- Quotas, weighting, confidence intervals, or design effects are not discussed.
- Weighted results depend heavily on a small number of participants.
Worst-Case Outcome
Minor differences may be treated as real market divisions. A team could prioritise the wrong segment, feature, price point, or campaign because random variation and weighting effects were mistaken for dependable evidence.
A Safer Approach
Sample planning can begin with the intended comparisons, expected response variation, acceptable uncertainty, recruitment method, and number of segments. A confidence interval describes sampling uncertainty under stated assumptions; it does not measure every source of error.
Mistake 5: Writing Questions That Shape the Answers
Why It Happens
Researchers and stakeholders already know the product language, so they may write questions that feel neutral to insiders but sound loaded, vague, technical, or overly positive to participants. Double-barrelled questions combine two issues, while unbalanced scales make one response direction easier to choose.
Early Warning Signs
- Questions contain praise, assumptions, jargon, or emotionally loaded wording.
- A single question asks about two features or experiences.
- Response options overlap or omit a reasonable answer.
- Earlier questions reveal the preferred concept before evaluation.
- The survey has not been piloted with people outside the project team.
Worst-Case Outcome
Participants supply the answer the questionnaire quietly invited. The resulting data can approve a weak concept, hide dissatisfaction, or exaggerate support while still appearing numerically consistent.
A Safer Approach
Questions can use familiar language, one idea at a time, balanced response options, and a suitable recall period. Randomising answer or concept order may reduce order effects. Cognitive interviews and small pilots can reveal how participants actually understand each question.
Mistake 6: Treating Stated Intent as Future Behaviour
Why It Happens
Questions such as “Would you buy this?” are fast and easy to score. They remove the real purchase conditions: limited budget, competing products, delivery time, switching effort, risk, and the possibility of doing nothing.
Recall bias and social desirability can also affect answers. People may describe what they would like to do, what they believe sounds sensible, or what they remember imperfectly.
Early Warning Signs
- Demand forecasts depend mainly on hypothetical purchase questions.
- The tested concept has no realistic price or competing option.
- Intent scores are not compared with past behaviour.
- High enthusiasm produces few wait-list joins, trials, deposits, or completed purchases.
Worst-Case Outcome
Forecast demand can exceed actual adoption. Inventory, staffing, advertising, or development capacity may then be committed to a product that people liked as an idea but did not choose under real conditions.
A Safer Approach
Stated intent can be interpreted alongside behavioural evidence such as search activity, sales records, product usage, abandonment, trials, pre-orders, observed choice, or controlled experiments. Past behaviour is not a perfect forecast either, but it gives the claim a stronger base.
Mistake 7: Using One Research Method for Every Question
Why It Happens
Teams often repeat the method they already know. Surveys may be used when the real need is exploration; interviews may be used when the decision requires prevalence estimates; analytics may be used without knowing why users behaved as they did.
Early Warning Signs
- Method selection happens before the research question is settled.
- Every project becomes a survey, focus group, or dashboard analysis.
- Qualitative comments are converted into market percentages.
- Quantitative findings are reported without contextual explanation.
Worst-Case Outcome
The evidence answers a different type of question from the one facing the decision-maker. A few interviews may be treated as proof of market prevalence, or a survey may measure only needs the team already knew to list.
A Safer Approach
Method choice can follow the question. Interviews, observation, diary studies, and contextual inquiry can explore motives and unmet needs. Surveys can estimate patterns within a defined population. Experiments and A/B tests can examine behaviour under controlled changes. Sales, CRM, support, and product analytics can show what occurred in actual use.
Mistake 8: Ignoring Response Quality and Nonresponse Bias
Why It Happens
Completed responses are easy to count, while missing and unreliable responses require investigation. Online studies may contain duplicate participation, automated entries, false identities, survey speeding, straight-lining, inattentive answers, or participants motivated only by incentives.
Nonresponse creates a different issue. People who decline or abandon a study may differ from those who finish it, especially when the topic, survey length, language, device compatibility, or timing affects participation.
Early Warning Signs
- Completion times are implausibly short.
- Open-text answers are copied, unrelated, or repetitive.
- Respondents select the same scale position across long grids.
- Screening answers conflict with later answers.
- Dropout rates are high for certain devices, regions, or participant groups.
Worst-Case Outcome
Low-quality or missing data can alter segment sizes, satisfaction scores, concept rankings, and demand estimates. If the problem is discovered late, the study may need to be repeated and confidence in later research may decline.
A Safer Approach
Quality checks can be planned before collection rather than invented after seeing results. Screening consistency, duplicate detection, completion time, attention checks, open-text review, device testing, and transparent exclusion rules can all help. Response rates and dropout patterns may reveal who is missing.
Mistake 9: Combining Secondary Sources Without Checking Definitions
Why It Happens
Industry reports, government data, search trends, social listening, competitor websites, review platforms, and internal records can reduce research time. Yet sources may define the market, customer, sale, region, or reporting period differently.
Competitor visibility can also be mistaken for competitor performance. Advertising activity, social engagement, review volume, website traffic estimates, and product availability are indirect signals. They do not automatically reveal revenue, retention, margins, customer satisfaction, or operational health.
Early Warning Signs
- Figures from different sources are added without reconciling definitions.
- Publication dates are recorded but data collection dates are not.
- Estimates are repeated across reports that may share one original source.
- Social attention is treated as proof of lasting demand.
- Source methods, exclusions, and geographic coverage are unclear.
Worst-Case Outcome
A market may appear larger, faster-growing, or less competitive than it really is. The same underlying estimate can be counted several times, while a visible competitor or viral TikTok trend is mistaken for durable category demand.
A Safer Approach
Each source can be logged with its original publisher, collection period, population, geography, definitions, method, exclusions, and known limits. When two figures cannot be reconciled, presenting them as a range may be more honest than forcing them into one number.
Mistake 10: Treating a Single Research Period as Normal Demand
Why It Happens
A snapshot is often collected when the organisation needs an immediate answer. Customer behaviour may still be affected by holidays, promotions, school calendars, weather, product shortages, platform changes, competitor launches, or unusual news coverage.
Early Warning Signs
- Data covers one week, campaign, event, or sales period.
- No comparison exists with earlier months or equivalent periods.
- A promotion ran during the study but is absent from the interpretation.
- Recent growth is projected forward without testing whether it is temporary.
Worst-Case Outcome
Temporary demand may be treated as a permanent shift. Capacity, stock, hiring, or product priorities could be expanded just as the short-lived effect disappears.
A Safer Approach
Current findings can be compared with historical baselines, matched periods, cohorts, and external events. In smaller projects, even a simple record of promotions and timing can improve interpretation. Larger systems may benefit from repeated tracking with stable measures.
Mistake 11: Confusing Association With Cause
Why It Happens
Two variables may move together without one causing the other. Heavy users might report greater satisfaction because satisfied people use the product more, because experienced users understand it better, or because another variable affects both usage and satisfaction.
Small numerical differences can also receive too much attention. A low p-value does not show that an effect is large, useful, unbiased, or likely to repeat outside the study.
Early Warning Signs
- Reports use causal words for observational data.
- Possible confounders are not considered.
- Many comparisons are tested and only favourable results are reported.
- Relative changes are shown without absolute values or base rates.
- Tiny effects are described as decision-changing without a practical threshold.
Worst-Case Outcome
A company may change a feature, message, or customer journey believed to cause an outcome, only to find that the relationship disappears when applied. The intervention can consume resources or make the original outcome worse.
A Safer Approach
Language can match the study design: associated with for observational findings and caused only when the design supports that claim. Randomised experiments, matched comparisons, longitudinal data, and sensitivity checks may help separate competing explanations.
Mistake 12: Averaging Away Meaningful Customer Differences
Why It Happens
Overall averages make reports easier to read. They can also hide opposing patterns. One segment may strongly prefer an option while another rejects it, producing a moderate average that accurately describes almost nobody.
Early Warning Signs
- Only total-market scores appear in the report.
- Means are used for heavily skewed distributions.
- New, retained, and lapsed customers are combined.
- Regional, channel, role, or use-case differences are unexplored.
- Segments are created only after analysts find an appealing result.
Worst-Case Outcome
A single product or message may be designed around the average response. It performs weakly because the market contains several distinct jobs, constraints, and purchase situations rather than one average customer.
A Safer Approach
Segments can be based on decision-relevant differences and defined before final analysis where possible. Sample sizes still matter: subgroup estimates with few observations may be treated as exploratory rather than precise. Distributions, medians, ranges, and individual response patterns may reveal what an average conceals.
Mistake 13: Selecting Evidence That Supports the Preferred Answer
Why It Happens
Research rarely happens without organisational preferences. A team may already favour a launch, market, feature, or message. Confirmation bias then affects which questions are asked, which participants are trusted, which metrics are highlighted, and which contradictory findings are labelled as exceptions.
Early Warning Signs
- Success measures change after results are visible.
- Positive findings appear in headlines while negative evidence moves to an appendix.
- Unexpected results are repeatedly blamed on participants or methodology.
- Stakeholders request new cuts of the data until a preferred pattern appears.
- No one is assigned to challenge the main interpretation.
Worst-Case Outcome
Research becomes a justification exercise. Warning signs are documented but neutralised, allowing a weak plan to proceed with the appearance of evidence-based approval.
A Safer Approach
Decision criteria, exclusions, primary measures, and stopping rules can be recorded before analysis. Reports can include evidence for and against each option, alternative interpretations, and findings that did not fit the expected story. Independent review may help when internal incentives are strong.
Mistake 14: Moving From Research to Full Commitment Without Testing Uncertainty
Why It Happens
Once research is complete, teams may feel pressure to act decisively. Estimates are converted into one forecast, limitations disappear from presentations, and the recommended option moves directly into a large rollout.
A polished dashboard can become a map of the wrong territory when its assumptions are not tested. The visual certainty is stronger than the evidence underneath it.
Early Warning Signs
- The forecast contains one number rather than a plausible range.
- No downside scenario or failure condition is documented.
- The decision cannot be reversed or scaled down easily.
- No pilot, holdout group, staged launch, or monitoring plan exists.
- Research limitations do not appear in the final decision document.
Worst-Case Outcome
A high-cost or difficult-to-reverse decision is made on assumptions that were never stress-tested. When demand, adoption, cost, or customer response falls outside the central estimate, the organisation has little room to adjust.
A Safer Approach
Research findings can be translated into ranges, scenarios, and explicit assumptions. In smaller projects, a limited pilot may expose adoption barriers. In larger systems, staged releases, control groups, decision checkpoints, and ongoing measurement can reveal whether the expected effect survives real conditions.
General Risk Patterns Across Research Projects
| Risk Pattern | What Becomes Distorted | Useful Check |
|---|---|---|
| Decision mismatch | The study answers a different question from the business decision. | Can each research question be linked to a possible action? |
| Population mismatch | Participants do not represent the people affected by the decision. | Who has no realistic chance of entering the sample? |
| Measurement distortion | Question wording or study conditions shape the response. | Would a participant interpret the question as intended? |
| Context loss | Timing, channel, price, role, or use case disappears from analysis. | Under which conditions might the finding change? |
| Interpretation overreach | An association, small difference, or estimate becomes a stronger claim. | What does the study design genuinely allow the team to say? |
| Commitment risk | An uncertain finding supports a large irreversible action. | Can the decision be piloted, staged, monitored, or reversed? |
A More Reliable Path From Question to Decision
- Define the decision. Record the options, current assumption, deadline, and evidence that could change the choice.
- Set the population boundary. Identify users, buyers, approvers, non-customers, excluded groups, locations, and use cases.
- Match methods to questions. Separate exploration, measurement, explanation, and causal testing.
- Plan recruitment and quality controls. Consider coverage, screening, quotas, subgroup needs, nonresponse, duplicates, and inattentive responses.
- Test the instrument. Review wording, answer options, order effects, mobile usability, survey length, and participant interpretation.
- Record analysis rules early. Define primary measures, exclusions, segments, weighting, thresholds, and stopping rules.
- Look for conflicting evidence. Compare claimed preferences with behaviour, internal data, secondary sources, and opposing explanations.
- Report uncertainty plainly. Show ranges, assumptions, limitations, subgroup sizes, missing populations, and plausible alternatives.
- Scale the action to the evidence. A reversible pilot may suit uncertain findings better than a full commitment.
- Monitor the real outcome. Compare observed adoption, retention, usage, and customer response with the original forecast.
A useful stopping question: “What would need to be untrue for this decision to fail?” If the answer points to an assumption that has not been tested, the research may not yet support the size of the planned commitment.
Frequently Asked Questions
What is the most common market research mistake?
Beginning without a defined decision question is one of the most damaging errors. It affects method selection, sampling, questionnaire design, analysis, and reporting. The study may collect accurate information that still does not resolve the decision.
Can a large sample still produce misleading market research?
Yes. A large sample can remain biased when it excludes parts of the target population, relies on volunteers, contains poor-quality responses, or uses flawed questions. Sample size mainly affects sampling precision; it does not repair every form of error.
Why do purchase-intent surveys overestimate demand?
Hypothetical questions remove many real purchase constraints, including price, timing, alternatives, switching effort, and limited budgets. Participants may also express approval without being willing to complete an actual purchase.
Should market research use surveys or interviews?
The choice depends on the question. Interviews can explore motives, language, needs, and unexpected barriers. Surveys can estimate patterns within a defined population. Many decisions benefit from combining qualitative, quantitative, behavioural, and experimental evidence.
How can confirmation bias affect market research?
Confirmation bias can influence the questions selected, participants recruited, metrics highlighted, exclusions applied, and interpretations accepted. Recording decision criteria and primary measures before analysis can make selective reporting easier to detect.
When is market research strong enough to support a decision?
That depends on the cost, uncertainty, and reversibility of the decision. A low-cost reversible choice may need less evidence than a large rollout. Findings are more useful when assumptions, ranges, limitations, conflicting evidence, and monitoring plans are visible.
What is the difference between market research data and market evidence?
Data consists of collected observations, responses, transactions, or measurements. Evidence is data interpreted in relation to a defined question, population, method, and decision. Data becomes weak evidence when those connections are missing.